See whether readers click your related and popular lists, and whether they stay to read the post they open. Available in Ariadne Pro.
Where to find it
Go to Ariadne Related Posts → Analytics. Pick a date range at the top: today, 7 days, 30 days, 90 days or All time. Numbers refresh every 10 minutes. If you keep data for less time than a range, the screen tells you the range is cut short. For example, with 30 days kept, the 90 days range shows only 30 days.
Counting needs two settings, both on by default in Pro:
- Count views and read depth, on the Matching tab.
- Count clicks, on the Popular tab under Counting.
If one of them is off, the Analytics screen says so and links to the setting.
What each number means
| Number | What it counts |
|---|---|
| Views | Times a post was open and on screen for 5 seconds or more, from any source: search, social or your lists. |
| Lists seen | A list counts as seen when at least half of it is on screen for 1 second. Every kind of list is added together: Related, Inline, Up next and every Popular list. Up next counts once it slides in. |
| Clicks | Clicks on the cards in your lists. |
| Click rate | Clicks divided by lists seen. 40 clicks from 1,000 seen lists is 4%. |
| Read after click | The share of clicks where the opened post stayed on screen for 5 seconds or more. Quick exits count as not read. So do visits that could not be tracked, for example when a visitor has not agreed to statistics on a site that asks. |
| Scrolled after click | How far down the opened post those readers got, on average. 100% is the end of the post. |
On the screen, “All list types” under a number means it adds up every kind of list. Hover or tap the i next to any number to see the same explanation.
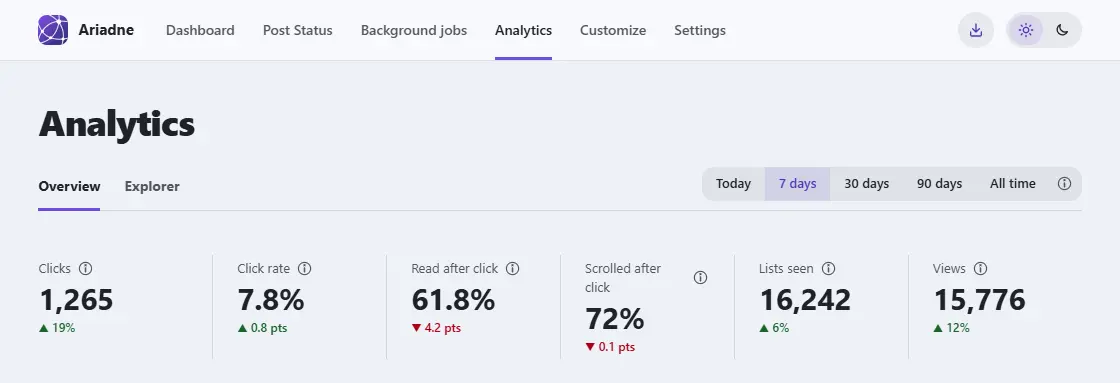
The Overview tab
- Six numbers: the ones in the table above.
- Change from the period before: each number shows how it moved, for example “▲ 12%”. Click rate, read after click and scrolled after click change in percentage points. Today is not over yet, so it is compared with the same time of day. Morning numbers don’t read low. The change shows only when Ariadne still keeps the whole earlier period, so you never see “up 100%” from nothing. For the 30 days range, keep data for 90 days or more. For 90 days, keep data for 180 or 365 days. Today and All time show no change.
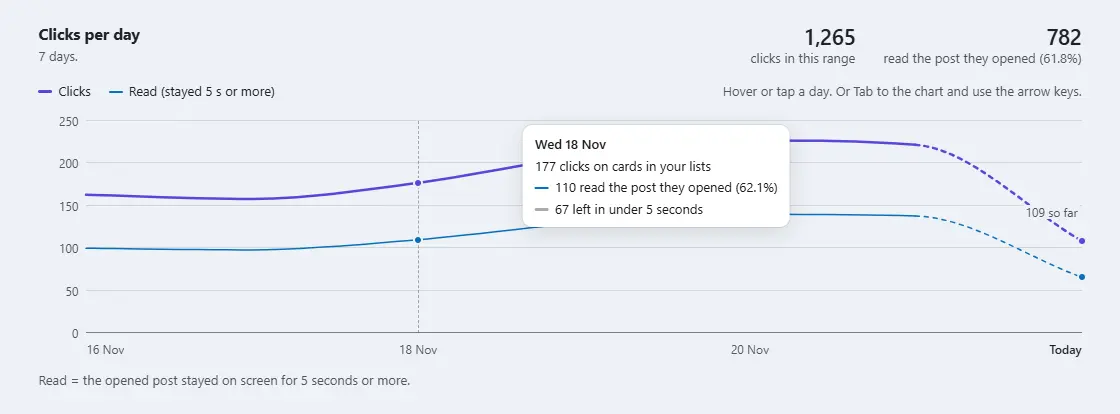
- Clicks per day: a line chart with two lines, clicks and reads. Today’s part is dashed, because the day is not over yet.
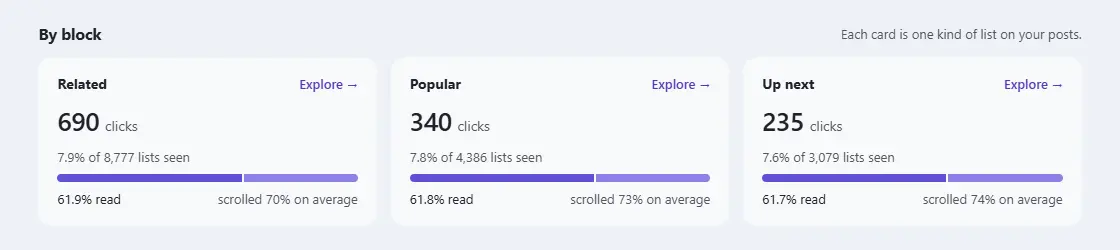
- By block: one card for each kind of list, with its clicks, click rate and reads. Popular lists show as up to three kinds: Popular (after the article), Popular inside Related, and Popular widget (the block, shortcode or widget). Click Explore on a card to see only that kind.
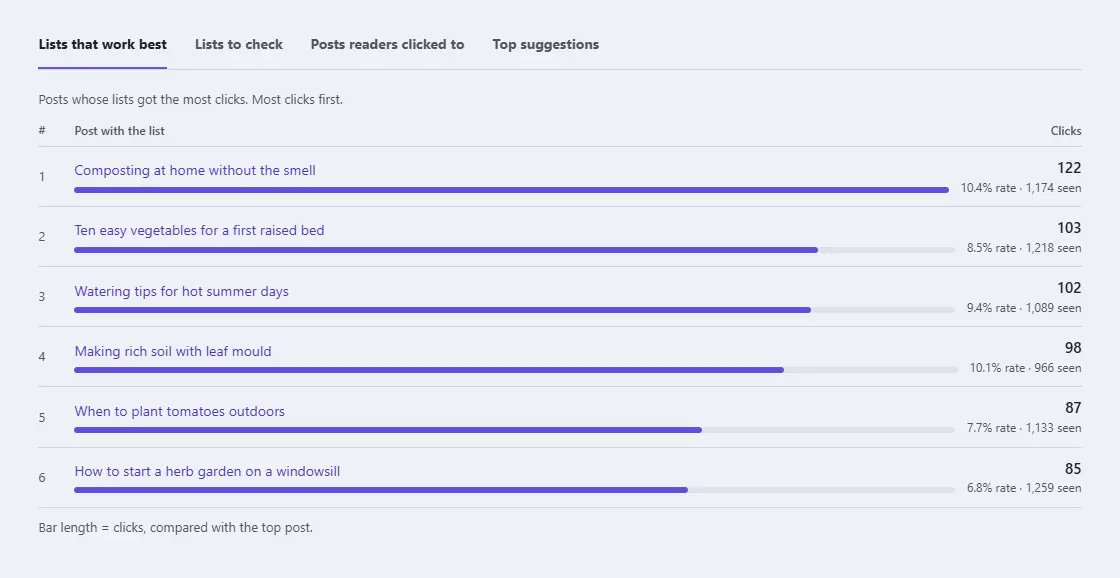
Below the cards, four lists sit behind tabs:
- Lists that work best: the posts whose lists get the most clicks.
- Lists to check: lists seen at least 100 times but rarely clicked, lowest click rate first. The line on each bar is your site average.
- Posts readers clicked to: the posts your lists send readers to most.
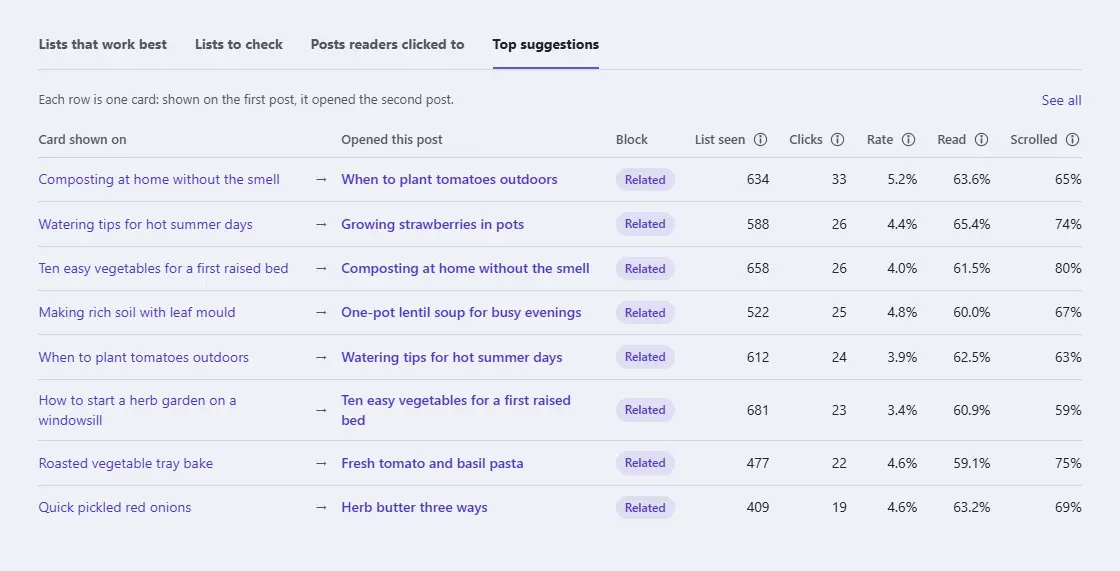
- Top suggestions: single links, from the post with the card to the post it opened.
The Explorer tab
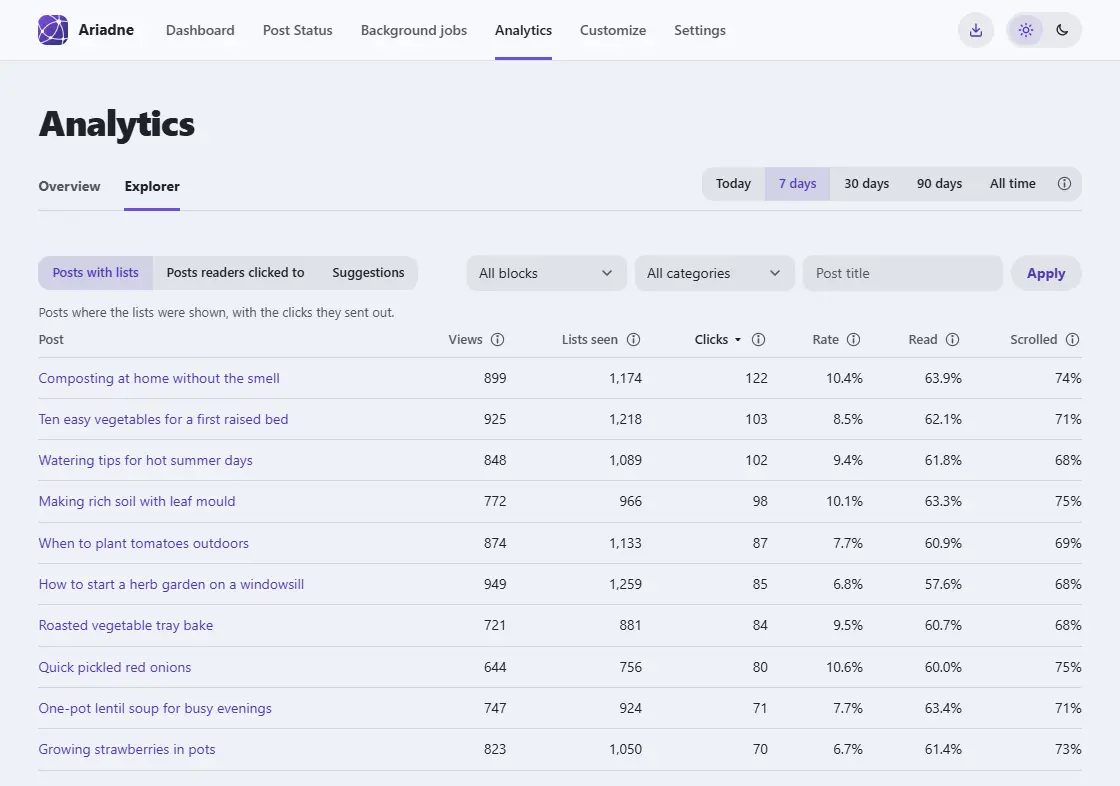
The Explorer has the full tables. Switch between Posts with lists, Posts readers clicked to and Suggestions. You can filter by kind of list and by category, search for a post title, and sort by any column. Suggestions and the page for one post only cover the days you keep data for, even on All time.
One post’s page
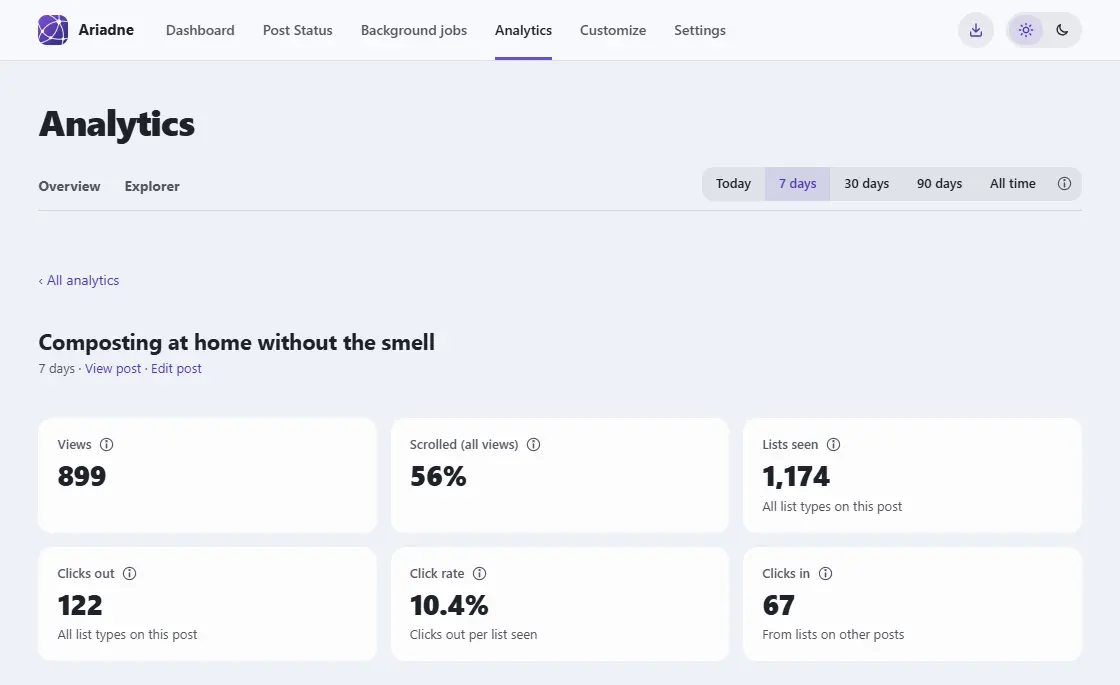
Click a post title anywhere on the screen to open its page. It shows:
- The post’s views, how far readers scrolled, and how often its lists were seen.
- Clicks out: clicks on the cards on this post, list by list.
- Clicks in: clicks on other posts’ cards that opened this post, and which kinds of list sent them.
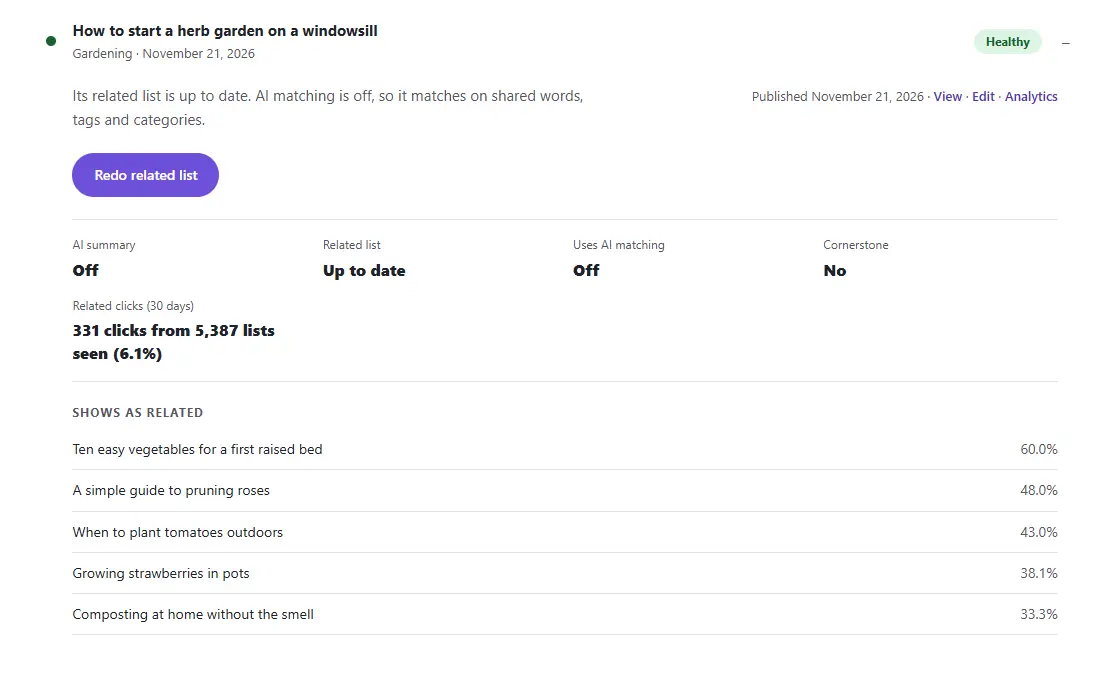
The Post Status screen also shows each post’s related clicks for the last 30 days, with a link to this page.
Sharing the numbers
Use the Export button (the download icon) at the top of the screen. You can export a PDF report, a CSV file or a JSON file.
Email reports
Ariadne can email you a short summary. Go to Ariadne Related Posts → Settings → Popular and find Email report. Under Send a report, pick Every week (last 7 days) or Every 30 days (last 30 days). It is off by default.
The email has a few lines on how your lists did, the six numbers with their change, and Lists to check. A link opens the full screen. Send it to Everyone who can view reports, or pick These addresses and add up to 50 email addresses. Click Send me a test now to see one first.
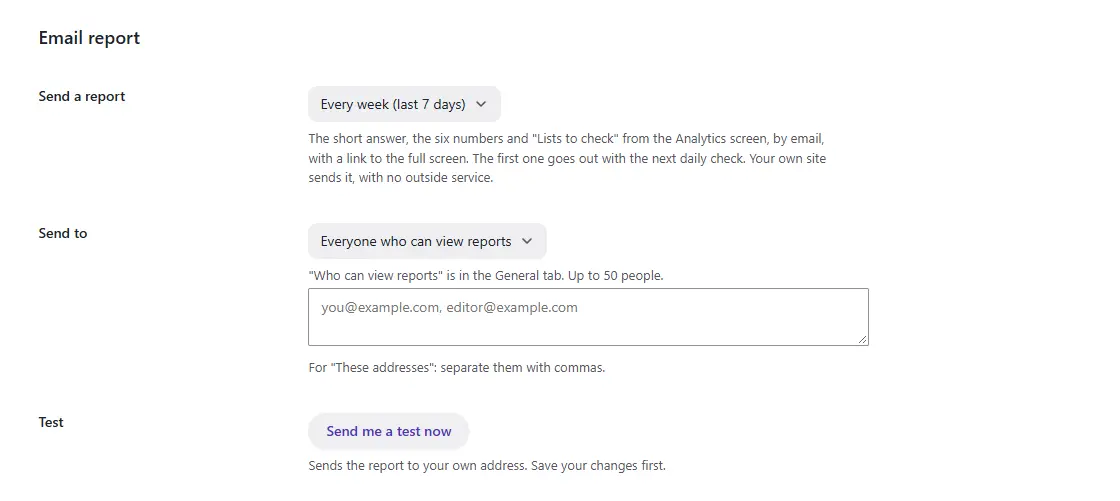
Your own site sends the email with WordPress’s mail. No outside service is used. If your site’s other emails don’t arrive, set up a mail (SMTP) plugin first.
On the Dashboard
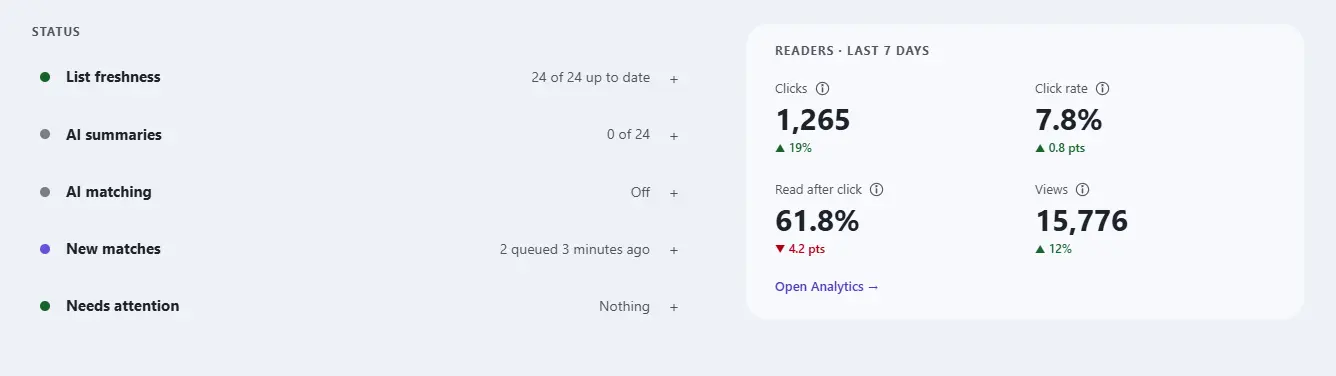
The Ariadne Dashboard has a Readers · last 7 days card. It shows clicks, click rate, read after click and views, each with its change, and a clicks-per-day chart below. Only people who can view reports see it.
What Ariadne keeps
Only daily totals, in your own database. No cookies, no IP addresses, no browser details, and nothing is sent to another service. To tell if a click turned into a read, Ariadne keeps one tiny note in the reader’s tab for up to 30 minutes, then deletes it. With a consent plugin that supports the WP Consent API, that note is only kept after the visitor agrees to statistics. Logged-in editors and common bots are not counted. Choose how long daily totals are kept under Keep data for on the Popular tab: 30, 90, 180 or 365 days. 90 is the default. After that, only monthly totals stay. The privacy page has the details.
If your licence ends
Ariadne stops counting. Your numbers stay on the Analytics screen, and you can still export them.