What each row in the Dashboard’s System Health panel actually measures, including the two that are easy to misread.
What this panel is for
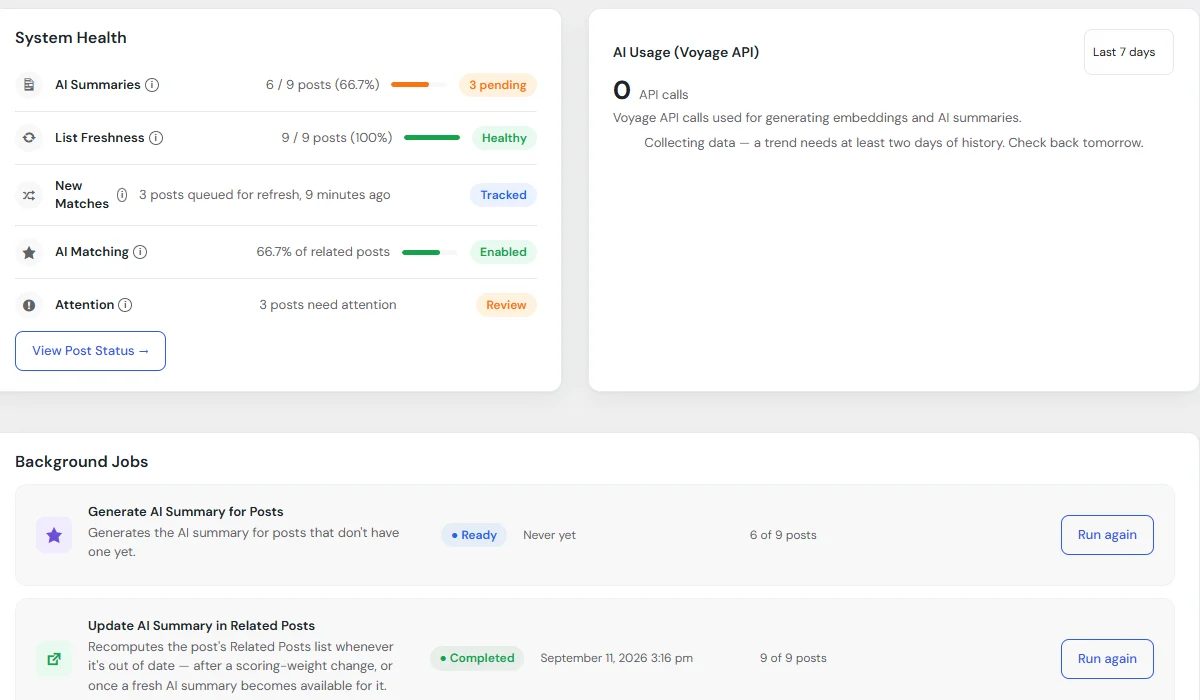
System Health is a quick check on whether the background work behind related posts is keeping up, not a support ticket or an error log. Each row shows a count out of your published posts, a percentage, and a status pill. Every row also has a small outlined “i” next to its name. Hover it, or tab to it with your keyboard, for a one-line reminder of what that row means. This page goes into more depth than that one line does.
If your site uses a custom content type instead of regular Posts, these rows automatically use that type’s own name instead of “posts.” A store running related products, for example, sees “products” throughout instead.
AI Summaries
This row counts how many of your posts have AI-summary data on file: the piece of information the AI-matching signal actually compares between posts to judge how closely two are related. A post is counted here once that data has been generated for it. Nothing in this row means a post has a written summary you’d read anywhere. It’s the plugin’s own name for the underlying AI data, not a text blurb.
List Freshness
The natural reading of this row is “how many of my posts have related posts,” but that’s not what it measures. It measures how many of your posts have an up-to-date related-post computation, whatever that computation actually turned up for each one.
A post counts as current here the moment its related list has been recalculated under your site’s present matching rules, even if that recalculation found zero matches. A post can also have an older list still showing on the front end while its own computation has already fallen behind, which is exactly what this row is watching for. It can tell you whether a post’s computation is caught up. It can’t tell you whether that post actually has any matches showing.
This number moves whenever something changes that affects every post at once, like adjusting a matching setting, or something that affects one post specifically, like that post’s own AI data finishing or regenerating.
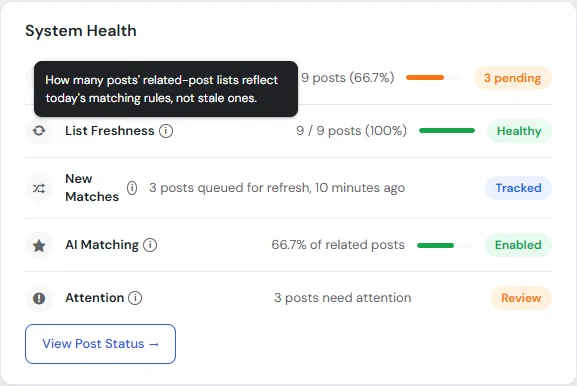
The “i” next to this row’s name is a good example of how the tooltips work: hover or focus it, and a short reminder appears right above the row.
New Matches
This row works differently from the others. It isn’t a percentage of your site, it’s a running note of one specific event: a brand-new post getting saved and, in the process of figuring out its own related posts, turning out to be a good match for an older post too. When that happens, the older post gets queued for a refresh, so its own related list can pick up the new post as an option next time it updates.
This row shows how many older posts are currently queued that way, and how long ago the most recent one was queued, or a plain note that nothing’s queued if none are. It isn’t a separate background process by itself. The actual refresh work for anything queued here happens through the same related-posts job listed further down the Dashboard, under Background Jobs.
AI Matching
This is the row most likely to get read backwards. It sounds like it describes which posts get matched to each other using AI. It doesn’t. It describes, for each post counted here, whether that post’s own related-list computation had AI data available to use at the moment it ran, instead of falling back to tag, title, and text matching alone.
This row is about the post doing the searching, not the posts it found. A post can be counted as having used AI matching and still end up with a related list made entirely of posts it matched by tag or title. Whether AI data was available and how good the matches turned out to be are two different questions, and this row only answers the first one.
The status pill next to this row, Enabled or Not configured, is a separate signal from the percentage. It only reflects whether an AI API key is set up on your site at all. The percentage can be genuinely low, even 0%, while the feature itself is fully enabled, if most of your posts simply haven’t been reprocessed since the key was added.
Attention
This row is one combined count of posts that still need a background pass: posts with no AI summary data yet, plus posts whose related-list computation is out of date, each post counted once even if it falls into both groups at the same time.
One thing this row deliberately leaves out: a site sitting at 0% on AI Matching sitewide, simply because no AI API key has been added yet. That’s a normal, valid setup, not a per-post problem, so it doesn’t inflate this count.
Checking whether background work is actually running
System Health itself doesn’t include a row for whether background jobs are currently active. That detail now lives just below it, in the Dashboard’s own Background Jobs section, which covers each job individually rather than folding them into one combined status: when each one last ran, its progress on the current batch, and a manual button to run one on demand if you don’t want to wait. If Attention stays high for a while, that section is the right place to check whether the jobs behind it are actually moving.
That section also tells you when something is holding the jobs back:
- Background jobs are paused. Someone turned on Settings → Matching → “Pause background jobs.” Posts you save still get their own list; turn the pause off to let the rest catch up.
- Background requests are not arriving. The jobs keep themselves moving by sending small requests to your own site. A firewall, a security plugin or a site-wide password can block them. The jobs then only move when someone visits the site. WordPress’s Tools → Site Health shows the same warning.
- AI summaries are paused (Pro). Voyage AI returned an error, so the job waits before trying again, longer after each failure, up to an hour. The message shows the last error; a rejected key gets a hint to check it. Below it, “Recent background errors” lists the latest problems and links to any post involved.
- Today’s AI request limit is reached (Pro), if you set one. AI summaries continue the next day.
The AI usage chart
On Pro, the Dashboard also charts how many requests went to Voyage AI each day, for the last 7, 30 or 90 days, with the number of tokens used (what Voyage bills by). Days with no requests show as zero. The “vs previous” change only appears once there’s a full previous period to compare with.
Reading them together
On a caught-up site, AI Summaries and List Freshness sit close to 100%, New Matches shows nothing queued or clears quickly, and Attention sits near zero. Right after a bulk change, adding an AI key, publishing a large batch of posts, or changing a matching setting, it’s normal for Attention to jump and for Background Jobs to show real activity for a while as the queue works through it. That’s the system doing its job, not a fault.